The Clustering function is a specialized context calculation that generates a new custom column, statistically calculating ways to classify the current query's data points into groups (or clusters). Clusters group the data points based on some similar details, which are numerically determined - thus providing a way to automatically find like elements within a data set for further analysis. For example, clustering a list of customers allows you to see if any distinct grouping of the customer and their buying habits. This may allow you to better target marketing campaigns or find more suitable products to sell to specific groups.
Clustering in Discover is based on the K-means algorithm which uses 'vector quantization'. The number of clusters is represented by the variable K. Each data point is assigned to a the cluster with the nearest mean distance. The Model tool offers numerous other clustering algorithms that can be used instead as well as custom logic written in Python or R. This feature is particularly useful with viewing the results in scatter, bubble, and bubble map charts, but it can be used and applied in all visualizations.
Note: Clustering from Discover is not supported on MS OLAP, Tabular and SAP BW data sources.
Note: Advanced Analytical functions may not be available in your user profile.
Using the Clustering Function
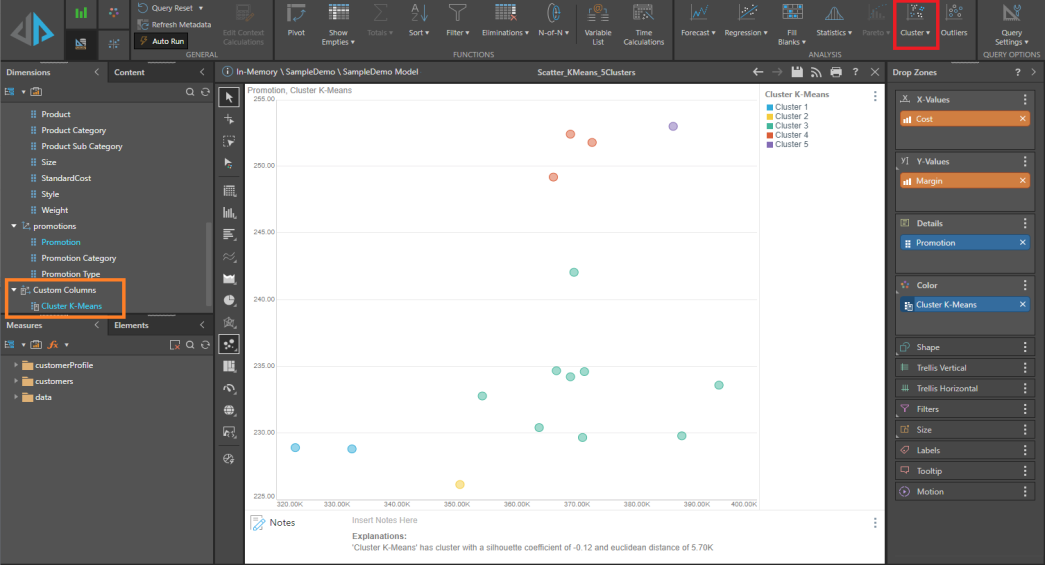
To use the Clustering function, simply click the Cluster button (red) from the Query ribbon. Using the top part of the button, the default clustering logic will be used by assigning 5 clusters to the data set. Alternatively, click the dropdown and select the number of K clusters you would prefer.
A custom column is generated and added to the Color drop zone. It is also added to the Dimensions panel, under Custom Columns (orange). You can view the custom column's elements (from the Elements panel), and interact with its members (the clusters) to perform further analysis.
Removing Clusters
The cluster logic produces a specialized hierarchy (blue chip) that segments the query into the cluster groups. To exclude cluster logic from your query simply remove the chip from the relevant drop zone.
Explanations
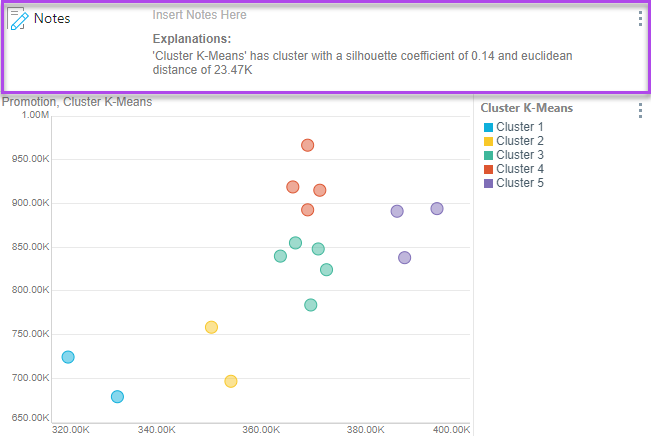
Applying a clustering calculation to the query auto-generates an explanation that you can show in your visual using the Notes tool. This explanation describes how the clusters were calculated; it contains the calculation name, the silhouette coefficient and an explanation of this value, and the euclidean distance.
To view the auto-generated explanation, click Show Notes from the Design ribbon. The explanations can also be viewed downstream in presentations.
In the example below, the explanation describes how the clustering calculation was evaluated for the query: